
This study evaluates the partial life cycle GHG associated with the procurement under the authority of 5 PSPC regions in order to identify the procurements that cause the most impacts and on which it would be a priority to act
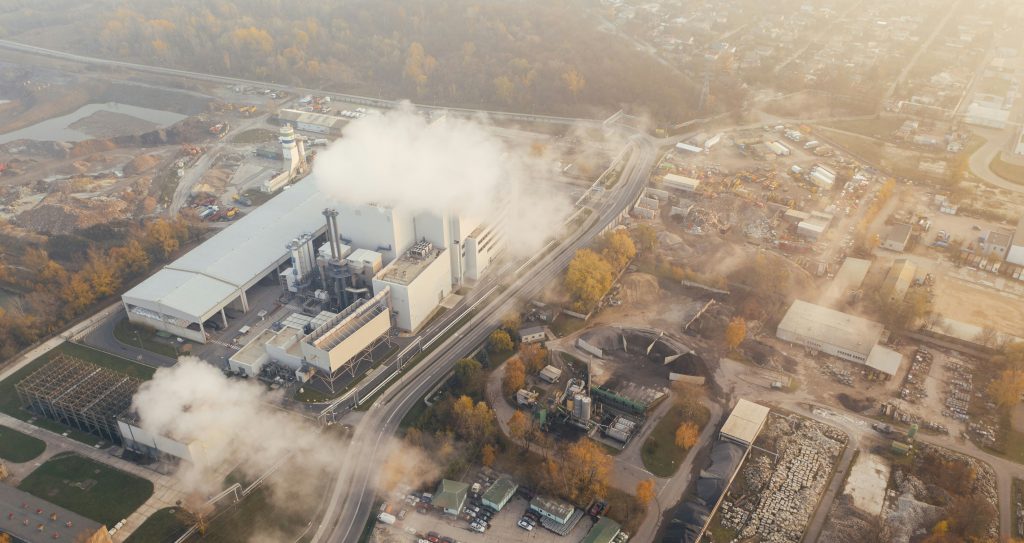
In line with the federal government’s commitments to climate change and environmental protection, Public Services and Procurement Canada (PSPC) has to address the ecological and social aspects of federal procurements and seek to reduce their associated greenhouse gases emissions (GHG). This study evaluates the partial life cycle GHG (the carbon footprint) associated with the procurement under the authority of 5 PSPC regions, namely Pacific (acquisitions for British Columbia and the Yukon Territory), Western (Manitoba, Saskatchewan, Alberta, Nunavut, and the Northwest Territories), Ontario, the National Capital Region (NCR, for Ottawa and Gatineau), and Atlantic (New Brunswick, Nova Scotia, Prince Edward Island and Newfoundland and Labrador) in order to identify the procurements that cause the most impacts and on which it would be a priority to act (e.g. close monitoring of the procurements, adding targeted criteria in its calls for tender).
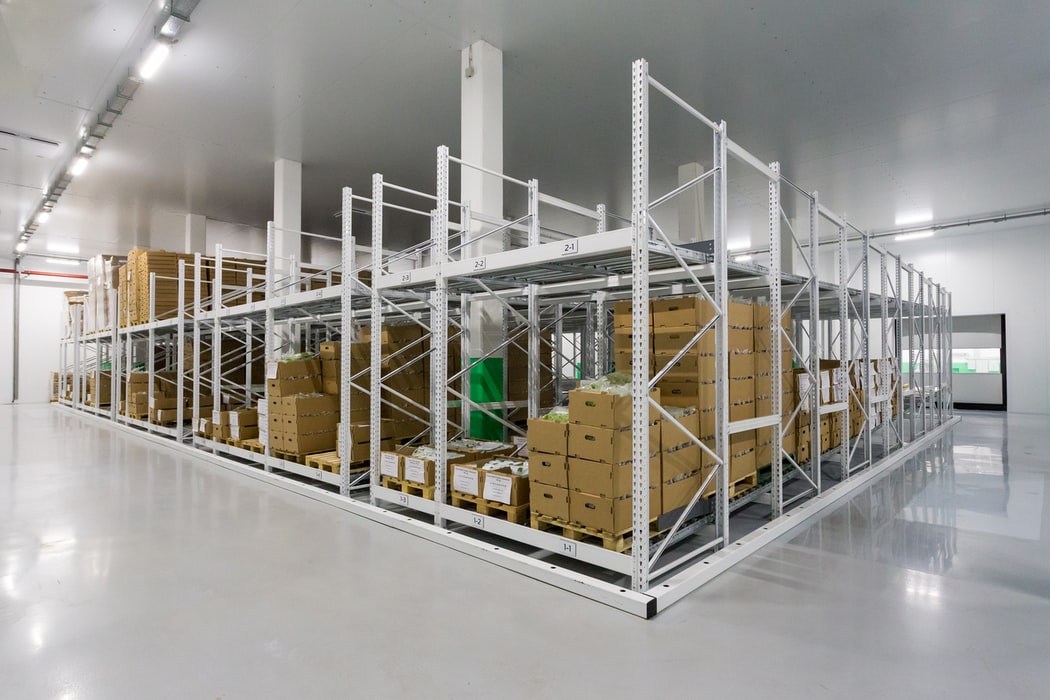
Contracts for goods and services awarded by PSPC for a total of 93 different customers (including PSPC itself) have been evaluated for each of the last three fiscal years (FY2016-2017 to FY2018- 2019). First, an economic overview is provided for each region, highlighting the categories of goods and services that constitute most of procurement, per customer, in value. About 2 000 to 3 000 contracts are covered annually for a total amount of $ 0.4 to 1 billion in every region, except for NCR (16 000 to 17 000 yearly contracts for $ 11 to 13 billion). Then, the carbon footprint is calculated using openIO-Canada, a model for environmentally extended input-output analysis (EEIO), which is based on financial data and is an appropriate tool to evaluate thousands of goods and services that are very different from each other, and for which neither accurate description nor physical data is easily available. The footprint analysis is “cradle-to-gate” (gate of the manufacturing plant) for goods. Thus, the footprint does not cover the whole life cycle of a good with respect to the GHG associated with its distribution, use during lifetime and end-of-life management. However, for services, the carbon footprint includes the delivery/provision of the service to the user. The boundaries of the carbon footprint assessment can be pictured as follow.
Thus, the footprint does not systematically cover the whole life cycle of a good with respect to the GHG associated with its distribution, lifetime use and end-of-life management. Therefore, it is only a partial life cycle assessment.
To read the report on Quebec region, please click here.